Thoughts on programming, web development and design.

Circuit Board

Category: Design Page 6 of 22

Add Simple CSS Animation to Your UI

When you create a web page, you use tools like fonts, colors, photos, illustrations and shapes to draw attention to important parts and guide the user on how to use your page. Another tool that you can add to help convey information is animation. Animation allows you to add movement or motion on your page. People are hardwired to respond and react to movement. By adding animation, we can use it as another technique for communicating with our users.

Add Simple CSS Animation to Your UI

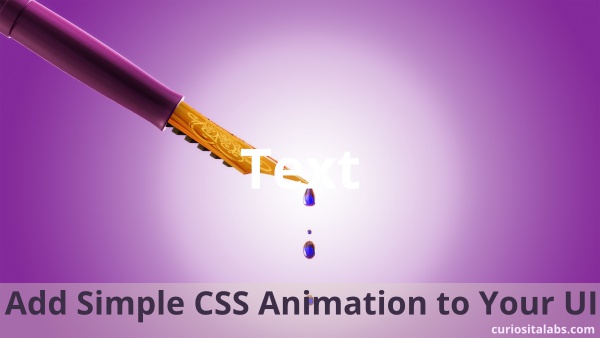
Photo by: Image by Ambady Sasi from Pixabay

Why use animation?

Animation helps you to draw people’s attention the part of the page that has changed, show users where to look next or highlight the arrival or removal of important information. You can use it for telling a story, branding and improving your user’s experience.

What do you need to remember when adding animation?

  • Don’t animate everything. Use it sparingly. Animation should help guide people on using your page not distract or confuse them.
  • Make sure it fits with your style or brand. If you are playful and not serious, you can use animation that has a playful aspect. If you are more serious, you want your animation to be simple and functional.
  • Don’t assume that your animation will work on all devices. You need to test, test and test again.

What kind of animations can I use?

You can add animations to a dashboard, web app or mobile only features. One popular method is to change the hamburger menu to an X. This change lets the user know that the menu can be closed. You can add animations to images on hover or in a gallery.

Hamburger Menu changes to an X

See the Pen
Animated – Hamburger Icon (spans)
by Steven Roberts (@matchboxhero)
on CodePen.

CSS Animation on Hover

See the Pen
Playing a CSS animation on hover
by Val Head (@valhead)
on CodePen.

Accordian Image Gallery

See the Pen
Accordion Image Gallery
by Stefan C. (@stefcharle)
on CodePen.

How can I learn more about animation?

CSS Animation Rocks
A CSS Animations Tutorial
CSS Tricks – Animation
Create Cool UI Animations in CSS

3 Dashboard Design Inspirations on CodePen

An easy to read dashboard has from 5-9 pieces of information on it. By combining color, fonts and icons, you can make a dashboard simple and easy to use. I found these three examples on CodePen that you can use to inspire your own designs.

Bootstrap 4 Dashboard Stats Example

It shows 6 different statistics using Bootstrap 4. Each statistics is in a separate box that was built using the card layout. @elmorabityounes uses the default classes from Bootstrap to color the background, border and text. The text formatting is kept simple by using header tags to display the copy. Each box has its own icon from Font Awesome. The result is a simple design with no additional CSS or JavaScript.

Bootstrap Dashboard Indicators

When you design a dashboard, you’ll need to use different type of indictors to display information. Herman Starikov shows you how to use Bootstrap to create different indicators. He combines Font Awesome, Flexbox and CSS Animation. Herman also uses icons as decorative background elements. With CSS and Animation, your dashboard doesn’t have to be plain or boring.

Full Dashboard Design

CodePen Admin Dashboard

This complete Dashboard has a statistics, charts, a map and a chat box. Haidarali Nadi Shah demonstrates how to use Flat design, Font Awesome and JavaScript for functionality and additional theming. It includes a side menu bar that shrinks and expands when you click on it.

With the above examples, you can include different pieces of information in your design. You can choose to HTML and CSS, a CSS Framework like Bootstrap or include JavaScript to create more complex functionality. No matter what methods you choose, you can create a dashboard that provides your customers with the information that they need. Before you design your next dashboard, remember to review these 3 Dashboard Design Tips.

Variable Fonts on the Web

Variable fonts is an OpenType font specification that puts different variations of a typeface into one single file instead of multiple font files for every variation that you may need. With a standard font, your visitors have to download multiple files which leads to more HTTP requests and data to their browsers. With a variable font, the file size may be about the same but you’ll have access to a much wider range of styles than currently available. For example, a font like Roboto has twelve font files which includes twelve variants. The variable font has one file and unlimited variants.

Variable Fonts on the Web

Photo By: Maret Hosemann

Can I Use It?

Not all browsers and operating systems support variable fonts. For example, Linux OSes need to download the latest Linux Freetype version and Macs need to use a Mac High Sierra (10.14) and Mojave.

For non-supporting browsers, you can use CSS Feature Queries to determine if it should load a standard font instead.

Why use Variable Fonts?

You can use a single font file that provides you with a wide range of widths, weights, slants and more. With less font files to download, your visitors don’t have as much to download. With a variable font, you have greater flexibility on how your text displays. You can use a wider variety of font variants to create certain affects that help define your style and voice. With most major browsers supporting this font type, you can start to use them in your next project.

Where can I see Variable Fonts in action?

You can try them out on v-fonts and Axis-Praxis.

Where can I learn more?

3 Dashboard Design Tips

Dashboard design sounds simple. You want to create a way of presenting data to your users that is clean and easy to understand. Easy right?

3 Dashboard Design Tips

Photo by: rawpixel.com from Pexels

No, dashboard design is more difficult than it seems. You need to consider your users before you can decide what data to present to them and how.

Ask these questions before you start building

  1. What data needs to be show to your users? You want to track a small number of key metrics. Not all data should be on a dashboard. Some data belongs in a report. If the data your considering is a summary or analysis, it may work better as a report.
  2. How am I going to present this data? You can choose to display the data as a chart, gauge, totals or a simple table.
  3. What actions do you want the user to take? Should they click on a link to open a report, update some information or do nothing?

Sketch out your design

After you researched and learned what data the user wants to see, you need to decide how to organize the data. You may find that you have too many pieces of information to present to the user. Sketch out your dashboard before you build it to determine what pieces of data go where. An easy to read dashboard has from 5-9 pieces of information on it. Remember that less is more.

Keep the design simple

You want your users to be able to scan the dashboard quickly. Help them by choosing to limit the number of pieces of information, colors, fonts and other UI elements. Your design should be minimal.

By asking questions before you build a dashboard, sketching out the design and keeping the design simple, you can give your users key pieces of information quickly.

More information on Designing With Data
Data Visualization Best Practices 2013

3 Tips for Better Forms UX

When you enter information into a form, it is easy to make mistakes. How do you help your users make less mistakes? You provide them with defaults. Defaults can help users to fill out a form quicker, make decisions easier and reduce errors.

3 Tips For Better Forms UX

Photo by: BiljaST

When you build a form, you need to get different types of information. Some information like their name, address and email address need to be entered by the user. Other information like state, country, gender or some other information that requires a decision can use a default. A default is the most likely option that a user would choose.

For example, your user is going to buy a product. The default quantity is one. You set the quantity for them, so they don’t have to. It helps them to make the purchase quickly. You don’t want them to think to hard on how many they want.

Should you use a drop down list or something else?

It depends. If you have a short number of options, you can use a radio button list. The list makes it easy to scan your options and choose quickly.

For a longer list of options like State or Country, a radio button list would be too hard to read. It is better to put the options in a drop down list. Most mobile devices can handle the use of a drop down list on a form. If you aren’t certain which one works better for your form, you can ask these 9 questions to help you decide.

Address Form with Defaults

Should you choose an option in a drop down list?

When you can, fill drop down lists like state and country with user data. For drop down lists that require a decision by the user, you can leave the field blank. By leaving them blank, people scan for the empty or blank fields and fill them in. They rarely change fields with defaults in them.

Should you use placeholders in fields?

If you are designing a short form with a couple of fields like a login or sign up form, then the answer is yes. You can use placeholders instead of labels on these forms.

Curves Join Form

When you create longer forms like an event registration form, don’t use placeholders. Use clear label, error messages and defaults to help guide the user through the form.

When you build a form, you can use these techniques to help guide them through filling out a form. Defaults, radio button lists or other input fields, pre-selected drop down lists and placeholders in fields when necessary. By making decisions for users and guiding them through the data entry process of your form, you can help make filling out forms faster and easier.

Page 6 of 22

Powered by WordPress & Theme by Anders Norén